This video explains it all in a very concise and clear manner, not much more needs to be said really …..
Tag: radiation
I am taking a online geology course for fun right now, the subject has always interested me and it is quite different from the maths heavy physics I am used to. Sweden has a grand history in geology, mineralogy and chemistry and chief among historic locations must be the mine in Ytterby, a suburb to Stockholm. In 1787 the lieutenant, chemist and amature geologist Carl Axel Arrhenius was sorting through the mine heap at Ytterby and discovered a unusually heavy black rock. Realizing that it must be a undiscovered mineral he sent samples of the rock to several chemists for analysis. The man that did the best job was Johan Gadolin and the mineral was named Gadolinite in his honor. The mineral contains, among other things, the element yttrium and it was the first of the rare earth elements to be discovered. Another 6 new elements where discovered in minerals from Ytterby and no less than 4 is named directly after the location (Yttrium, Terbium, Erbium and Ytterbium along with Skandium, Thulium and Holmium).
I happen to live in Stockholm which means a small field trip to Ytterby is a must and there I went a few weeks ago. Anyone that has been following the rare earth situation in China also knows that where there is rare earths usually one also finds Thorium, properly armed with a dosimeter I was looking forward to some rads!
Comments closedis on the way…. Nature has an article about it, here are some highlights.
The risk to the roughly 140,000 civilians who had been living within a few tens of kilometres of the plant seems even lower. Because detailed radiation measurements were un available at the time of the accident, the WHO estimated doses to the public, including radiation exposure from inhalation, ingestion and fallout. The agency concludes that most residents of Fukushima and neighbouring Japanese prefectures received a dose below 10 mSv. Residents of Namie town and Iitate village, two areas that were not evacuated until months after the accident, received 10–50 mSv. The government aims to keep public exposure from the accident below 20 mSv per year, but in the longer term it wants to decontaminate the region so that residents will receive no more than 1 mSv per year from the accident.
The WHO’s calculations are consistent with several health surveys conducted by Japanese scientists, which found civilian doses at or below the 1–15-mSv range, even among people living near the plant. One worrying exception is that infants in Namie town may have been exposed to enough iodine-131 to receive an estimated thyroid dose of 100–200 mSv, raising their risk of thyroid cancer. But data collected from 1,080 children in the region found that none had received a thyroid dose greater than 50 mSv. Chernobyl’s main cancer legacy in children was thyroid cancer.
But most importantly is this
A far greater health risk may come from the psychological stress created by the earthquake, tsunami and nuclear disaster. After Chernobyl, evacuees were more likely to experience post-traumatic stress disorder (PTSD) than the population as a whole, according to Evelyn Bromet, a psychiatric epidemiologist at the State University of New York, Stony Brook. The risk may be even greater at Fukushima. “I’ve never seen PTSD questionnaires like this,” she says of a survey being conducted by Fukushima Medical University. People are “utterly fearful and deeply angry. There’s nobody that they trust any more for information.”
To bad people like Sherman and Mangano, Gundersen, Busby, Caldicott, Matsumura and a host of other people and their fan clubs within the “environmental movement” are doing everything they can to spread excessive and scientifically unfounded fear of radiation.
3 CommentsAnother week has passed and more steps have been taken to get the situation under control. Lets start with the usual reactor status table made out of NISA data:
| Reactor 1 | Reactor 2 | Reactor 3 | |
| Water level (meter)* | -1.7 | -2.1 | -2.15 |
| Flow rate(m3/min) | 8 | 7 | 9 |
| Core pressure (kPa) | 1390 | – | – |
| Containment pressure (kPa) | 120 | 60 | 102 |
| Wetwell pressure (kPa) | 110 | – | 183.2 |
| Feedwater nozzle temp (Celsius) | 119.8 | 115.6 | 202.1 |
| Bottom head temp (Celsius) | 96.9 | – | 151.9 |
| Wetwell temperature (Celsius) | 51.4 | 66.8 | 40.0 |
| Containment dose rate (Sv/hour) | – | 22.7 | 12.2 |
| Wetwell dose rate (Sv/hour) | 1.1 | 148 | 0.480 |
| *Distance from top of assembly | |||
| – broken gauges or missing data |
Everything looks pretty stable except the wetwell dose rater in the number 2 reactor. It has increased to well over 100 Sv/hour from 37.1 in the last update I made (i wrongly wrote 0.371). I haven’t been able to follow the news so closely the last week so I have not seen if this has been mentioned in any TEPCO press release. Below is a graph of the increase. If anyone know of any action done on the number 2 reactor, starting the 3 or 4th of may please write a comment to this blog post.
A air filtration system has been connected to the reactor building of reactor number 1. The purpose of it is to get airflow through the building and clean out the air activity by filtrating the air. It is hoped that it will be enough to allow workers to enter the building and work safely without getting to much dose.
Kyodo reports that TEPCO plans to send in workers on monday in order to measure dose rates within the building. Seems strange that they would send in people when they have already used robots once for that purpose.
A longer video clip of the number 4 spent fuel pool can be seen over at Atomic Power Review. It doesn’t appear to be very damaged.
The big news of the week is that the prime minister of Japan has asked Chubu electric to shut down its Hamaoka nuclear power plant. Hamaoka has 3 operational nuclear power plants, all of them quite new. Started at 1987, 1993 and 2004. The newest one is a ABWR and would presumably have state of the art eartquake protection. The reason for the prime ministers request is a estimate that the site has a high probability to be hit by a 8.0 earthquake within 30 years. If the reactors indeed can not handle such a quake then the closure request is rational. But it does smell a bit like political posturing at this point. There is no legal precedence for such a situation and it is not clear if Chubu electric has to obey the request.
Links(English)
WNN Filters for Fukushima Daiichi 1
Blogs(English)
Atomic Power Review Japan updates: Fukushima Daiichi, Hamaoka
NEI NEI Weekly Update on Fukushima Daiichi – 5/6/1
Blogs(Swedish)
Effekt Monbiot brottas med sig själv
Genusnytt En KARL ska väl tåla lite strålning…
Forskarbloggen Hur många döda efter Tjernobyl?
inas insikter Tjernobyl idag / Fukushima imorgon?
Begrundat och Plitat Cesium och Jod verkar ge spikes i Fukushima när man gläntar på dörren …
/Johan
2 Comments10:00(CET)/08:00(UTC)/17:00(JST)
Just a short update for today. The number 2 turbine building basement is filling up with water as quickly as TEPCO is pumping it out. No word is said about how the similar work in number 1 and 3 is proceeding. Temperatures are on a downwards trend in all reactors. Pressure in the number 1 pressure vessel continues to climb slowly, containment pressures are stable. Not much new happening on that front.
The Japanese Nuclear Society has reported that their analysis shows that parts of the fuel of all 3 reactors has melted and dropped down to the bottom of the vessels. Small parts of molten fuel has according to their analysis dropped from the rods, solidified when hitting the water and then sunk to the bottom forming small grains. The grains are easily cooled since they have large surface area to volume ratio and they don’t form a geometry that is prone to re-criticality.
They also state it is unlikely that there is a large amount of molten fuel at the bottom due to the low temperature readings in the bottom head. Nothing really surprising there either and I pointed it out some time ago. None of this is really surprising.
Zeolite containing sandbags have been put outside the water intake for the number 2 reactors. Zeolite is a porous material that readily adsorbs different molecules (adsorbption is the process of molecules sticking to the surface layers of a material, as opposed to absorption that means its sucked into the material itself). It was used to clean contaminated water within the TMI power planet after the meltdown there.
TEPCO has ordered storage tanks from the US to use to store radioactive water in. IMO I think TEPCO is trying to do perfect when perhaps they should think about doing things adequate. It seems like the volume of water is so large that temporary solutions, like erecting temporary pools, should be considered. But then again it is always easy to be an armchair quarterback on opposite side of the Eurasian continent (other seems to share my general idea though). I haven’t seen any new published analysis of the radionuclide content of the water in the number 2 basement, it would be interesting to see what it contains. The dose rates from the water should be going down due to the I-131 decay. Over 95% of the I-131 has decayed now.
Nitrogen injection into the number 1 containment continues, but pressure in the containment has stabilized. Meaning there must be a leakage somewhere. The leakage can’t be very large however.
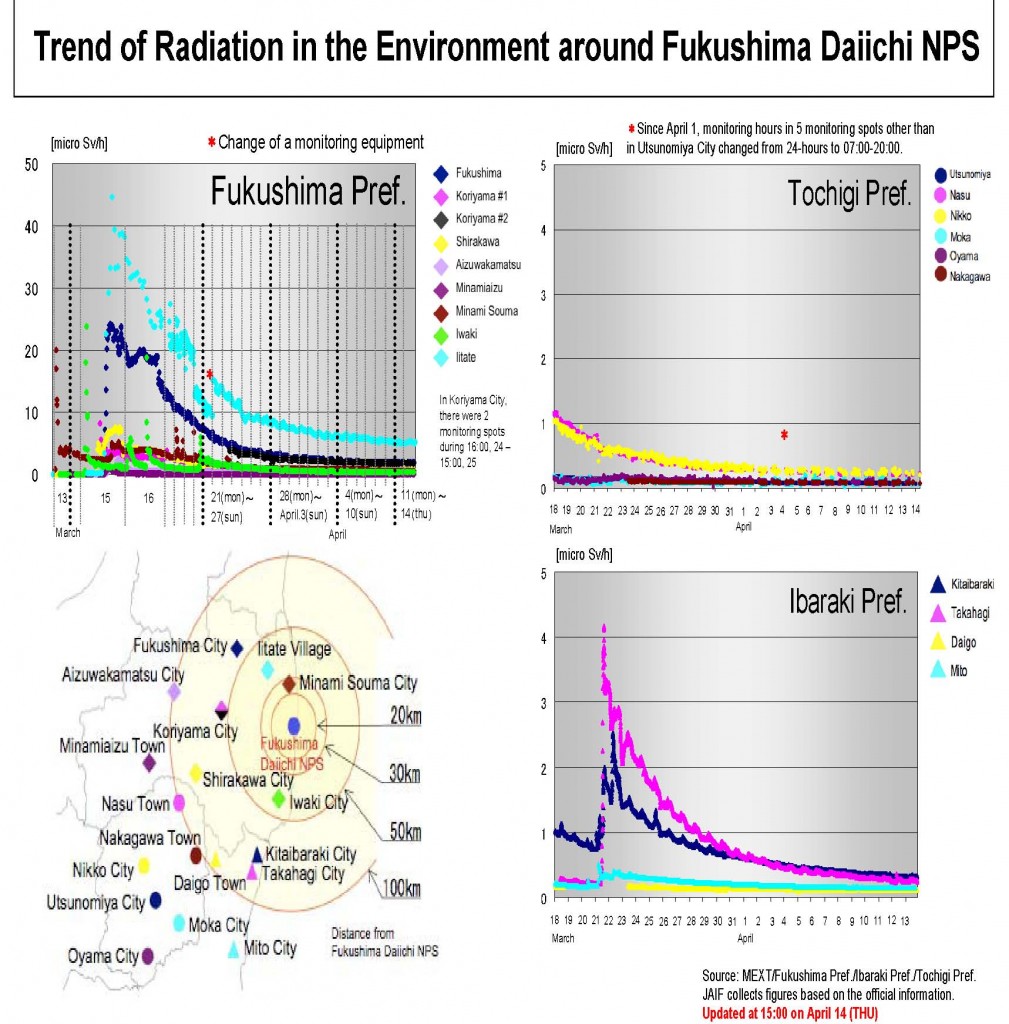
The radiation levels in the groundwater is increasing in the plant area. Otherwise radiation trends are all downwards around Fukushima. From IAEA
Gamma dose rates are measured daily in all 47 prefectures. The values tend to decrease over time. For Fukushima, on 13 April a dose rate of 2.0 µSv/h was reported. In the Ibaraki prefecture, a gamma dose rate of 0.14 µSv/h was reported. The gamma dose rates in all other prefectures were below 0.1 µSv/h.
Dose rates are also reported specifically for the Eastern part of the Fukushima prefecture, for distances beyond 30 km from Fukushima-Daiichi. On 13 April, the values in this area ranged from 0.2 to 26 µSv/h.
In addition to the 7 measurements referred to in yesterday’s brief, (note- these measurements were made at distances of 25 km and 33 km not 32 km and 62 km as reported), 13 more measurements were made on 12 April at distances of 25 to 33 km, West and Northwest from the Fukushima Nuclear Power Plant by the IAEA team. At these locations, the dose rates ranged from 0.5 to 16.5 µSv/h. At the same locations, results of beta-gamma contamination measurements ranged from 0.05 to 2.1 Megabecquerel/m2.
Analytical results related to food contamination were reported by the Japanese Ministry of Health, Labour and Welfare on 13 April that covered a total of 98 samples taken on 4 and 11 to 13 April. Analytical results for 76 of the samples of various vegetables, pork, seafood and unprocessed raw milk in nine prefectures (Chiba, Fukushima, Gunma, Ibaraki, Kanagawa, Miyagi, Niigata, Saitama and Yamagata) indicated that I-131, Cs-134 and/or Cs-137 were either not detected or were below the regulation values set by the Japanese authorities. In Fukushima prefecture on 11 April, twenty samples of various vegetables were above the regulation values set by the Japanese authorities for Cs-134/Cs-137, and one sample of seafood (sand lance) and one sample of spinach were above the regulation values set by the Japanese authorities for both I-131 and Cs-134/Cs-137.
Links(English)
Reuters Burrial of reactors tricky
Blogs(English)
Depleted Cranium Fukushima: Now a level 7, but nothing changes
All things Nuclear What Happened at Fukushima Dai-Ichi?
Atomic Power Review Brief update: Temperatures at Fukushima Daiichi 1,2,3
Atomic Power Review Fukushima Daiichi: Reactor cores
Atomic Power Review FACTS: Decommissioning of nuclear power plants
Links(Swedish)
Newsmill Japanska strålsäkerhetsmyndighetens INES 7-gradering endast temporär
Newsmill Brittisk miljöaktivist: Antikärnkraftslobbyn har bluffat om strålningens hälsorisker
Newsmill Japans unga revolterar mot kärnkraften
DN debatt ”Vi fattar inga panikbeslut om kärnkraften”
DN debatt”Att stänga två reaktorer skadar svensk basindustri”
Blogs(Swedish)
Rättvisan framför allt Långsiktighet, var god dröj.
Lotta Olsson Energipolitik är långsiktig…
In Your Face Kan du vika tranor?
Dr Angels blog Fukushima är ännu en mardröm
Update 19:00(CET)/17:00(UTC)/02:00(JST)
New NISA and JAIF updates. NISA from 06:00 and JAIF from 20:00. Same as usual JAIF number first and NISA after within ().
Reactor 1:
Water level in the core: 1.60 (1.60) meters below the top of fuel assemblies
Flow rate of injected water: 141 liter/minute
Core pressure: 603(603) kPa
Containment pressure: 285(280) kPa
Core temperature(feedwater nozzle):323.3 Celsius
Core temperature(bottom head): 139.4 Celsius
Dose rate within containment: 36 Sv/hour
Reactor 2:
Water level in the core: 1.5 (1.5) meters below the top of fuel assemblies
Flow rate of injected water: 117 liter/minute
Core pressure: unknown
Containment pressure: 100 (110) kPa
Core temperature(feedwater nozzle): 153.7 Celsius
Core temperature(bottom head): 77.7 Celsius
Dose rate within containment: 40.4 Sv/hour
Spent fuel pool temperature: 45 Celsius
Reactor 3:
Water level in the core: 2.3 (2.3) meters below the top of fuel assemblies
Flow rate of injected water: 200 liters/minute
Core pressure: 135 (135) kPa
Containment pressure: 108.5 (108.5) kPa
Core temperature(feedwater nozzle): 61.5 Celsius (obviously error)
Core temperature(bottom head): 120.9 Celsius
Dose rate within containment: 29.2 Sv/hour
Number one is quite hot, otherwise no major change. Running a bit short on time so Kyodo has a good summary of the situation and IAEA.
Update 08:30(CET)/06:30(UTC)/15:30(JST)
JAIF and NISA updates. NISA hasn’t released any new information on flow rates, temperatures or containment dose rates. There is no big change in the pressures or water levels of the reactors so I will omit the normal list of parameters I write down. If NISA release temperatures I will include it.
The Asahi Shimbun reports that TEPCO admits there is possible damage to the lower parts of the reactor pressure vessels. TEPCO states that the breaches can not be very large since the pressure in pressure vessels are maintained at a higher level than in the containment structure.
There seems to be a problem again in keeping the number 1 reactor cool. The temperature of the core increased to over 300 degrees celsius again and TEPCO had to increase the flow of water into the core.
Links (English)
Reuters Japan finds plutonium at stricken plant
NEI nuclear notes We should stop running away from radiation
Union of Concerned Scientists Where did all the water in the spent fuel pools go
Links(Swedish)
SvD Plutonium sprids i Fukushima
DN Plutoniumfynd vid Fukushima
Aftonbladet Plutonium i marken vid Fukushima
Expressen TEPCO chefen kan ha flytt från Japan
Röda Malmö
Krassman
Jinge
Röda berget
Uppkäftiga Uppsala
2 Comments
Two days ago we first got the report that there is highly radioactive water in the turbine building basement of reactor 1. NISA released this list of isotopes found in the water and its activity per cubic centimeter. I added half lives to the list to make it more understandable.
| nuclide | activity(Bq/cm³) | half life | Q value (keV) |
| Cl-38 | 1,60E+006 | 37,24 min | 4916,53 |
| As-74 | 3,90E+002 | 17,77 days | 2151 |
| Y-91 | 5,20E+004 | 58,51 days | 1544,82 |
| I-131 | 2,10E+005 | 8,025 days | 970,86 |
| Cs-134 | 1,60E+005 | 2,065 days | 1233,38 |
| Cs-136 | 1,70E+004 | 13,04 days | 2548,22 |
| Cs-137 | 1,80E+006 | 30,08 years | 1175,63 |
| La-140 | 3,40E+002 | 1,679 days | 3762,22 |
We see that there is one peculiar things, a high activity of Chloride-38. The only way for Chloride-38 to be created is by Chloride-37 in seawater absorbing a neutron and turning into Cl-38. This would indicate there is still a considerable neutron flux in the core. Forum discussions have been going on about it. The other peculiar thing is the activity levels, the activity per cm³ is just crazily high. I suspect they are really measuring activity per liter and mistakenly report it as cubic centimeter and I will give 2 arguments for that.
1. The activity of the water
They reported that 3 workers had been working in the water for more than an hour, their dosimeters showed a dosage close to 200 mSv and two of the workers didn’t wear rubber boots so they got a large surface dose on their ankles and feet from beta radiation(some reports say up to 6 gray). But this does not match with the activity levels seen in the table I pasted above. If one multiplies the activity in Bq/cm³ with the Q value, i.e the energy released in the decay of one atom, and massage the numbers a bit to get the numbers in joules instead of keV and in cubic meters instead of cubic centimeters. Then one finds that the water is putting out 1.68 Watts per cubic meter of water. Something like 20% of that energy is from gamma rays, the rest is beta rays and recoil energy in the decaying nuclei.
1.68 Watts doesn’t sound like a lot given that a normal water kettle can have a power of 1000 W. But in terms of ionizing radiation 1.68 W is just crazy. Radiation dose is measured in Grays, one Gray is equal to one joule absorbed by one kg of tissue and a Watt is as we know one Joule per second. A one Gray whole body dosage is enough to get radiation sickness, 10 Grays will kill you slowly(over a few days) and 100 Grays kills you instantly.
These workers where working in water that is putting out watts of radiation, that means they should have gotten hundreds of Grays in an hour. It was stated they where knee deep in this water! Now if we instead consider that perhaps they mean activity per liter, misstakenly reported as cubic centimeters, then everything goes down by a factor of 1000(there are one thousand cubic centimeters in a liter). Instead of hundreds of Gray the workers would have gotten hundres of milligray, that is consistent with their dosimeter readings.
2. The neutron flux needed to create Cl-38
The probability that a Cl-37 atom will absorb a neutron and turn into Cl-38 is quite low, 1 barn(this probability is measured in a unit called barns, one barn=10^-24 cm², uranium has as comparison a fission probability of about 600 barns). So one needs a lot of neutrons to create any significant quantity of Cl-38. If one assumes the water concentration of Cl-38 has dropped by a factor 1000 when traveling from the reactor vessel to the water in the turbine hall basement(dilution, decay etc). Then one can make a rough approximation of the neutron flux needed in the core in order to create the Cl-38 concentration seen in the turbine hall(technically solving the Bateman equation for a equilibrium case with one group cross sections).
Neutron flux ends up being around 10¹² neutrons per square centimeter and second. A reactor running at full power produces on the order of 10^14 n/cm²*s. The core would have to be running at about 1% of its full power(10-20 MW thermal) to produce that flux, but I might as well be off by a factor of 10 in my estimate of dilution, which would put the power in the rage from 1-100 MW. We can exclude 100 MW since we have not seen a pressure and temperature spike that high in reactor number 1. We can not exclude 1-10 MW power levels because it is on the same order as the decay energy. But if we also again here assume they mean Bq/liter instead of Bq/cm³ then the needed flux to produce the Cl-38 goes down to something around 1*10^9 neutrons/cm²*s. That kind of neutron flux could plausibly be around from radioactive decay or a very very low power level.
Those 2 factors together makes me believe they are reporting activity levels wrongly. Lets see if I will have to change my opinion when new information arrives.
Notes for the interested.
To convert from the unit eV(electron volt) to joule one multiplies 1 eV with 1.602*10^-19
The Bateman equation describes the time dependent concentration of radionuclides. For the case of a nuclide created by a neutron flux and destroyed by decay one gets this equation
dN/dT= N_37*sigma_37*flux – N_38*lambda_38
Where:
N_37=number of Cl37 atoms per cubic centimeter(I assumed saturated salt water at 100 degres, which gives 0.39 grams of salt per cm² which gives 9,74*10^20 Cl37 atoms per cm³)
sigma_37=neutron capture cross section, around 1*10^-24 cm²
flux=neutron flux in neutrons per cm² and second
N_38= Number of Cl-38 atoms per cm³.
lambda_38 = decay constant for Cl-38(equals to Ln(2)/half life)
If one assumes equilibrium then dN/dT=0 and one gets that
flux=N_38*lambda_38/(N_37*sigma_37)
One get N_38 from dividing activity with decay constant and then multiplying by a dilution factor.
Here are all the numbers I plugged in in case someone can spot an error.
| Find flux | |||||
| Avogadros number | 6,02E+023 | ||||
| Salt density(gram per cm3) | 3,90E-001 | Dilution factor(from vessel to puddle) | 1000 | ||
| Molar mass sodium | 2,30E+001 | Cl37 capture cross section | 1,00E-024 | ||
| Molar mass chlorine | 3,55E+001 | Cl37 number density (per cm³) | 9,74E+020 | ||
| Moles of NaCl | 6,67E-003 | Cl38 lambda | 3,10E-004 | ||
| Fraction Cl-37 | 2,42E-001 | Cl38 number density (per cm³) | 5,16E+009 | ||
| Moles Cl-37 | 1,62E-003 | ||||
| Number of Cl-37 per cm³ | 9,74E+020 | Flux | 1,64E+012 | ||
Links(english)
Kyodo News Woes deepen over radioactive waters at nuke plant, sea contamination
Reuters Soaring radioactivity deals blow to Japan’s plant
BBC Radiation soars at japan reactor
NHK extreme radiation detected at number 2 reactor
Links(swedish):
DN Arbetare evakueras efter akut strålning
SvD Fler svenskar misstror kärnkraft
SVD Nya bakslag vid Fukushima
Aftonbladet tio miljoner gånger högre strålning
Röda berget
Jinge
In your face
Kunskapssamhället
Svensson
There is a new website where you can see answers about the Fukushima events.
http://fukushima-answers.com/
Don’t fear the unknown. Ask!
Anxiety, fear, panic or resignation and passiveness . That’s what many people experience under the current overload of information spread by media and various interest groups. We believe that a sound mind doesn’t need other people to tell it what to think, what to fear or what to trust. It needs clear facts.Here you can find explanations in plain language from nuclear professionals . Ask questions, learn the facts and form your own opinion.
3 Comments…or…
How the Canadian Center for Policy Alternatives used nurses to lie to the government.
Surveys and questionnaires are a simple and effective way of gauging people’s opinions. The result can then in turn be used to influence the opinions other people hold, most often to become opinions you want people to have. And the more supposedly trustworthy the people you survey are, the greater you can expect the compliance to be.
Let me show you an example of this. This is a TV advert from 1949.
Simple enough isn’t it? If many medical doctors like this brand of cigarette, it must be really good, right? Right! Doctors can’t be wrong. Moving along…
Surveys and questionnaires that you make yourself have a nice bonus: you can make them any way you want. The advantage of this is that if you phrase the questions just right, you can get any answer you want.
10 Comments




Day sixteen after the tsunami
Published by Johan on March 27, 2011Uppdate 20:00(UTC)/22:00(CET)/05:00(JST)
NISA updates
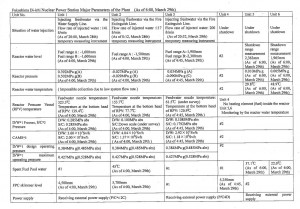
Reactor 1:
Water level in the core: 1.65 (1.65) meters below the top of fuel assemblies
Flow rate of injected water: 120 liter/minute
Core pressure: 508(517) kPa
Containment pressure: 270(270) kPa
Core temperature(feedwater nozzle): 224.8 Celsius
Core temperature(bottom head): 143.4 Celsius
Dose rate within containment: 34.6 Sv/hour
Reactor 2:
Water level in the core: 1.2 (1.2) meters below the top of fuel assemblies
Flow rate of injected water: 270-280 liter/minute
Core pressure: unknown
Containment pressure: 110 (110) kPa
Core temperature(feedwater nozzle): 123.6 Celsius
Core temperature(bottom head): 111.2 Celsius
Dose rate within containment: 41.6 Sv/hour
Spent fuel pool temperature: 67 Celsius
Reactor 3:
Water level in the core: 2.3 meters below the top of fuel assemblies
Flow rate of injected water: 220 liters/minute
Core pressure: 130 (133) kPa
Containment pressure: 107.3 (107.6) kPa
Core temperature(feedwater nozzle): 13.6 Celsius (obviously error)
Core temperature(bottom head): 121.6 Celsius
Dose rate within containment: 33.7 Sv/hour
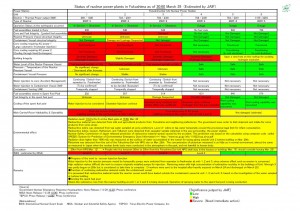
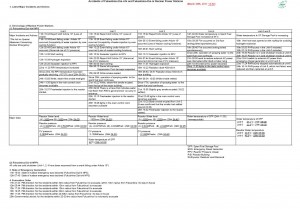
No major changes to the status of the reactors. Pressure in all containments seem ok. There is total confusion regarding the measured isotopes in the water in the basements for the turbine halls. It seems impossible to sort it out in any way and we can only wait for TEPCO or NISA to give final word on what they are actually measuring. It is pretty much beyond a doubt that the activities they published yesterday are wrong, it isn’t consistent with the given dose rates.
Update 10:00 (UTC) / 12:00 (CEST) / 19:00 (JST)
No new update from NISA during the night, but a new update from JAIF(link 1, link 2).
Reactor 1:
Water level in the core: 1.65 meters below the top of fuel assemblies
Flow rate of injected water: no new data
Core pressure: 508 kPa
Containment pressure: 270 kPa
Core temperature(feedwater nozzle): no new data
Core temperature(bottom head): no new data
Dose rate within containment: no new data
Reactor 2:
Water level in the core: 1.2 meters below the top of fuel assemblies
Flow rate of injected water: no new data
Core pressure: unknown
Containment pressure: 110 kPa
Core temperature(feedwater nozzle): no new data
Core temperature(bottom head): no new data
Dose rate within containment: no new data
Spent fuel pool temperature: no new data
Reactor 3:
Water level in the core: 2.3 meters below the top of fuel assemblies
Flow rate of injected water: no new data
Core pressure: 130 kPa
Containment pressure: 107.3 kPa
Core temperature(feedwater nozzle): no new data
Core temperature(bottom head): no new data
Dose rate within containment: no new data
Acording to TEPCO the dose rates from the water found in the turbin hall basement:
Reactor 1: 60 mSv/hour
Reactor 2: More than 1000 mSv/hour
Reactor 3. 750 mSv/hour
They have started to drain the water so that work can proceed to restore the pumps.
Links(english)
Kyodo News Woes deepen over radioactive waters at nuke plant, sea contamination
Reuters Soaring radioactivity deals blow to Japan’s plant
BBC Radiation soars at japan reactor
NHK extreme radiation detected at number 2 reactor
Links(swedish):
3 CommentsDN Arbetare evakueras efter akut strålning
SvD Fler svenskar misstror kärnkraft
SVD Nya bakslag vid Fukushima
Aftonbladet tio miljoner gånger högre strålning
Röda berget
Jinge
In your face