Barry Brooks over at Brave New Climate has created a new video that summarises the need for nuclear in 2,5 minutes. Well worth watching and spreading!
20 CommentsCategory: Uncategorized
We are now over 3 months into the Fukushima accident, progress is creeping along at a steady pace. Since our last update there has been lots and lots of new and I won’t try to cover it all. The biggest news I want to share now is that TEPCO has gotten some kind of recirculation cooling working, it was reported today by Will Davis at Atomic Power Review(by far the best blog to keep an eye on for Fukushima news, I highly recommend to read it).
In short water is leaking out of the containment buildings into the turbine buildings, the water is pumped from the turbine buildings into the water treatment facility, then from there its pumped back into the reactor. Its like I described in the last update on may 18th (shown on the picture below) and one of the steps in the plan TEPCO released that month.
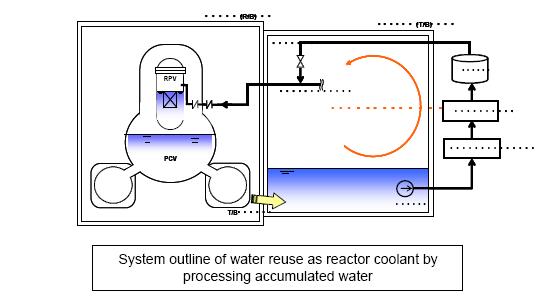
If everything goes well now the volumes of contaminated water will start to creep down, a proper toast is in order!
Another fairly recent news is that NRC announced that the spent fuel pools in Fukushima never went dry. That really calls into question Chairman Jaszco’s recommendation for a larger evacuation zone for american citizens in Japan than what the Japanese authorities had decided.
There has also been a lot of bullshit flying around about the situation in Fort Calhoun due to the river flooding around the nuclear power plant. Claims about goverment cover ups, Russian authorities warning about disaster etc. I haven’t bothered to look more in detail into it yet, but so far the reactor has both working diesels and connection to the external grid and quite a bit of margin before the river even comes near to flood over the flood protections. Here is a good post by Neutron Economy about the situation.
Why I’m not worrying about Fort Calhoun (and you shouldn’t either)
Links(English)
Rod Adams Ted Rockwell – Fukushima: It’s Not About Radiation, It’s About Tsunamis
NEI Nuclear Notes Friday Update
World Nuclear News Fukushima cover on its way
The Neutron Economy Expected Doses Over a Year and Evacuation of Fukushima Towns
Will Davis How the Misinformation Superhighway affects Nuclear Energy
Will Davis JAIF Public Opinion Poll Data
Links(Swedish)
Med örat mot rälsen Kärnkraften igen
Kultur Ska vi glömma Fukushima?
Seppo Laine Mycket värre än man kunde tro
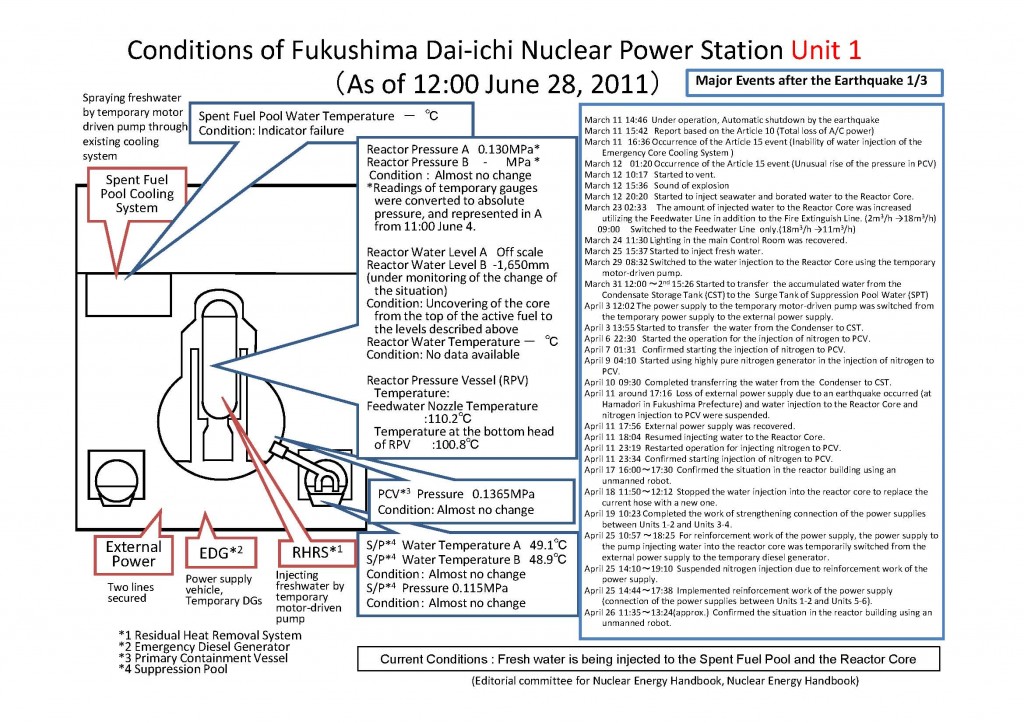
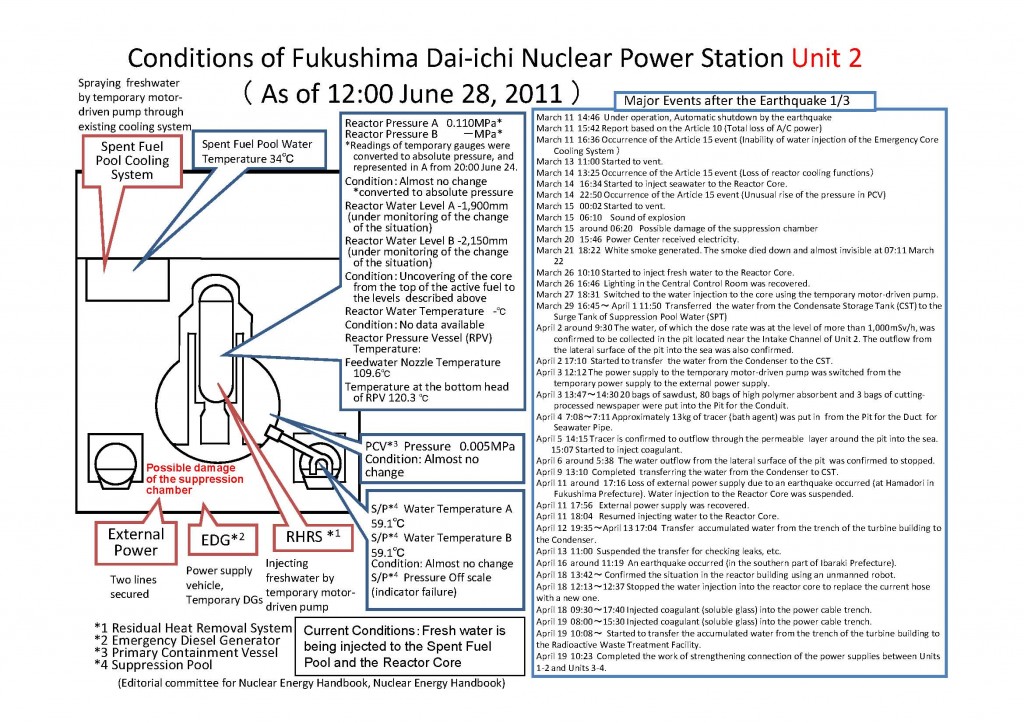
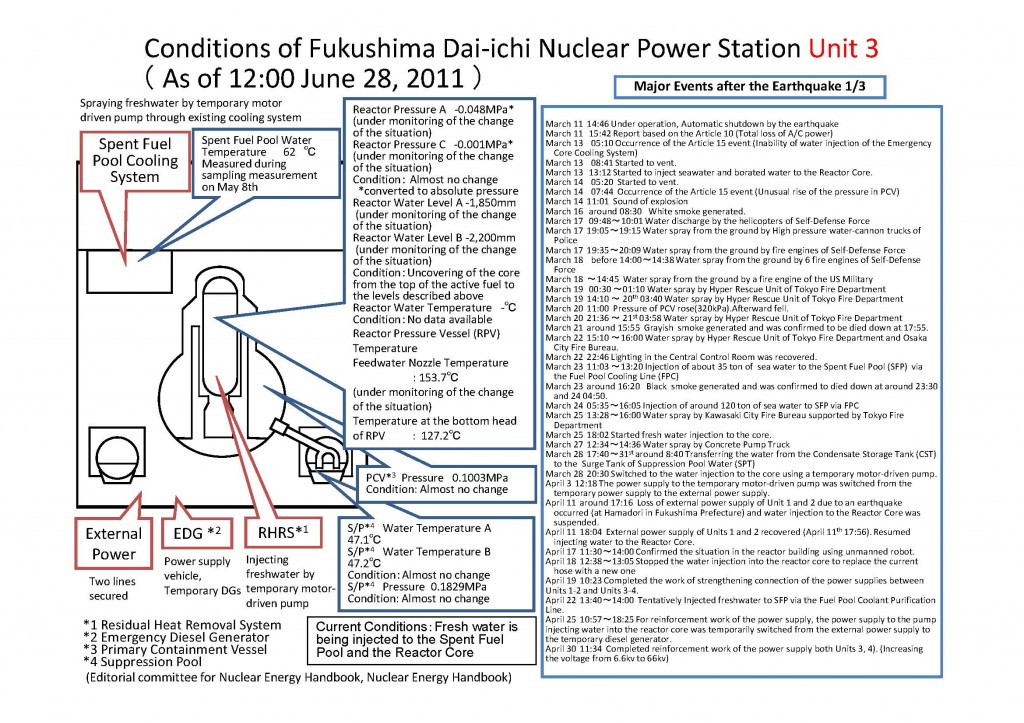
Status for each reactor
/Johan
4 CommentsMuck-raking is a journalistic activity with a proud history that since the days of Ida M. Tarbell and Jacob Riis have led to exposing cases of fraud, social injustice, conspiracies, environmental pollution, and other inconvenient truths, to the public. On a number of occasions it has led to changed laws and policies, and the end to political careers when somebody’s darker sides have been exposed. One important aspect of this activity is to check the facts carefully in order to get them right. Otherwise the muck-raking turns into cheap sensationalism in order to sell a few extra numbers. Every country has its own collection of this less honourable tradition that stems from the yellow press days of William Randolp Hearst and Joseph Pulitzer. However, the people behind the bi-weekly newsletter ConterPunch proudly refer to themselves in the following way:
Ours is muckraking with a radical attitude and nothing makes us happier than when CounterPunch readers write in to say how useful they’ve found our newsletter in their battles against the war machine, big business and the rapers of nature.
In a follow-up editorial on the Sherman-Mangano study (link to the original article here), CounterPunch editor Alexander Cockburn explains that they have received plenty of critique after publishing the article, several readers suspected cherry-picking. So they had their “statistical consultant”, Pierre Sprey, go through the data. And indeed, he found that there was no ground for the claims by Janette Sherman and Joe Mangano, when one includes a longer time span for the period before Fukushima. By increasing the time from the four weeks, that happen to be in the dip, to ten weeks, the relative increase in infant mortality after Fukushima disappears. So far so good, their control of the data verifies the conclusion that I and others independently of each other made (my version here). Now the interesting part comes. Cockburn says it the best himself:
But then Sprey went further and looked at the Sherman/Mangano selection of eight cities from the 122 reporting to CDC: the eight were Berkeley, Portland, Sacramento, San Francisco, San Jose, Santa Cruz, Seattle and Boisie. Apparently, they selected Pacific Coast cities that were more or less within 500 miles of the coast and north of Santa Cruz. However their selection did not include all CDC cities within this categorization, because they left out Tacoma and Spokane, thus leaving themselves open to suspicions of cherry-picking cities. So Sprey included Tacoma and Spokane in the data set he reviewed in order to be geographically complete. When Sherman and Mangano’s overall selection of cities failed to produce a significant result for ten weeks before and ten weeks after March 11, 2011 (as well for the ten equivalent weeks in 2010 as compared with the same weeks in 2011) Sprey elected to look at smaller, geographically consistent groupings of cities. The results were striking. Simply by moving the boundary line northward from Santa Cruz Sprey found that the four northernmost Pacific Northwest cities in the CDC sample – Portland, Tacoma, Seattle and Spokane – show remarkably significant results – a larger infant mortality increase than the original Sherman-Mangano results. During the ten weeks before March 11 those four cities suffered 55 deaths among infants less than one year old. In the ten weeks after Fukushima 78 infants died – a 42 per cent increase and one that is statistically significant. To confirm once again that these results were not due to seasonality Sprey compared these infant deaths in the ten weeks after Fukushima to the deaths in the equivalent ten weeks a year earlier. The results were almost identical with the ten weeks before Fukushima in 2011. Within the equivalent ten weeks of 2010 53 infants died in these four cities.
Imagine my surprise. I had been playing with the data a bit, and also checked what happens if you include Spokane and Tacoma (see the forum post for details). My conclusion was that Spokane and Tacoma did not matter, while Sprey’s re-analysis shows a 42% increase! I must have done some error, or? There were several steps when I copied the information into a spreadsheet, quite tedious to get it into the format that I wanted, so there were many possibilities for mistakes. So I made a few random double checks and could not find any error, but it would be very time consuming to go through the data for every week again. I also checked the published erratas on the CDC pages in order to see if I had missed some vital correction. But then I found a quicker way on the CDC web pages, it turns out that one also can download the data for individual cities or regions directly for the entire year (here). So I extracted the data for the four cities from this link, in this way I would do an independent check of my earlier results. Anyone can check it themselves on the link above. Here is my table:
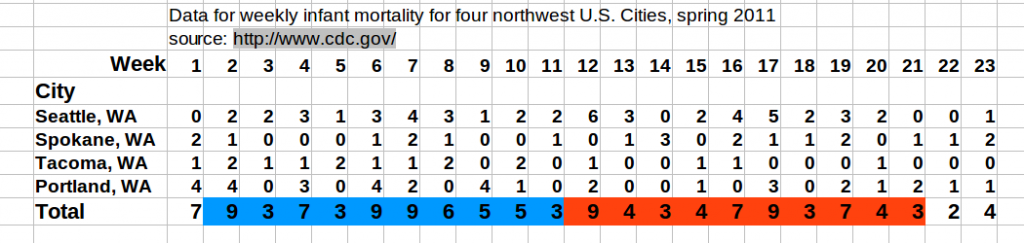
The table includes weeks 1-23 for 2011. If I understand what Cockburn writes correctly, Sprey have used weeks 2-11 for the time period before Fukushima (compared with the four weeks used by Sherman and Mangano) and weeks 12-21 for the time period after Fukushima (i.e. the same as Sherman and Mangano). So, with the use of a very complicated mathematical operation, called addition, I get 59 for the period before Fukushima, and 53 for the period after. This is identical with my earlier count. As a final check I asked another member of NPYP to make an independent extraction of the data from the CDC data base and then perform the mathematical operation mentioned above. Once again identical results. Sprey got 55 and 78, close enough on the first one, but the second…
Unless I am missing something vital, the numbers in the table above speak for themselves; There is no dramatic increase for these four cities, so something must have gone seriously wrong in Sprey’s re-analysis. Actually there are more strange things, Cockburn writes that for the 8 cities the new analysis gave “an increase of infant deaths of only 2.4 per cent” after Fukushima, while my analysis gave a 14% decrease (it is not statistically significant, but if I was pro-nuclear in the same way that Sherman and Mangano are anti-nuclear, I would of course argue for that Fukushima has caused a reduction in the infant deaths in northwestern U.S., and that I had the numbers to show it). Could it be the addition part that failed, or does wishful thinking of the style “there must be an increase in infant mortality somewhere due to Fukushima” play a part? Whatever the cause, Cockburn is explaining the significance of some details in the data from Sprey:
Looking a little more closely at the time trend of the infant deaths after Fukushima, Sprey found that the most dramatic increases in deaths were in the two weeks right after the March 11 disaster. Those two weeks saw a near tripling of weekly deaths, followed by a period of somewhat elevated weekly deaths lasting for about five weeks – roughly 25 per over the pre-March 11 rate, then settling down close to the average pre-Fukushima death rate for the last three weeks of the ten week period post-disaster. These results are necessarily approximate because the weekly sample of deaths is too small for precise statistical conclusions.
This part if of course nonsense when we look at the numbers. Let’s plot it as well:
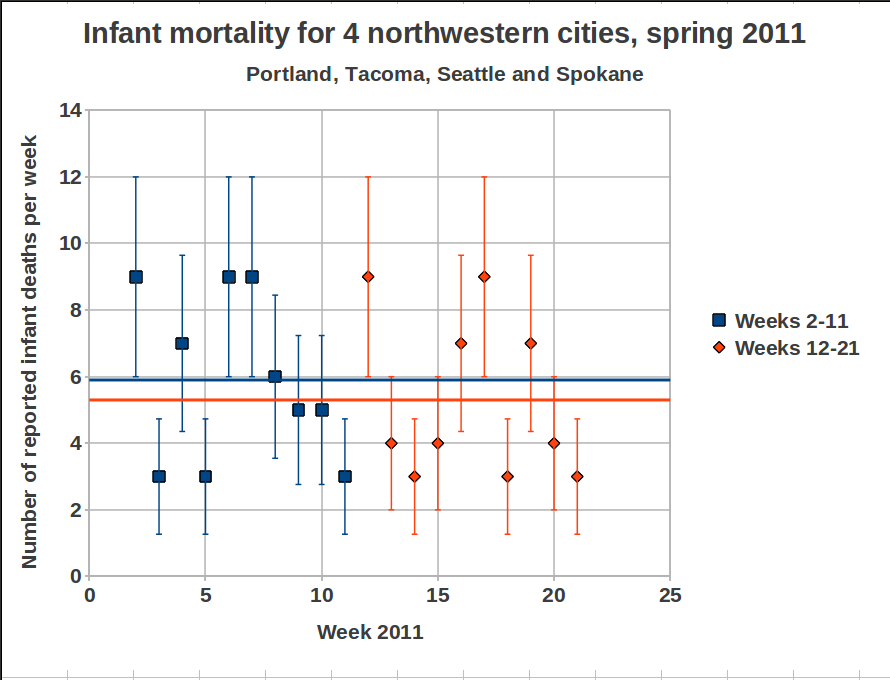
Well, as Cockburn says, there is a “dramatic” increase immediately after Fukushima, by a factor of 3. Now that we have the numbers ourselves we can conclude that a factor of 3 means a jump from 3 on week 11 to 9 on week 12. We have a similar increase in numbers between weeks 5 and 6, but Cockburn does not indicate that as being dramatic, in fact he does not mention it at all. To his defense, the numbers he is looking at are not the same as mine, but where do they come from? Whatever the cause of the error, the dramatic 42% increase now looks more like a…decrease, the mean values are shown as horizontal lines (blue before Fukushima, orange after) in the plot above. Let’s plot the data again to make sure, we can do it in the same way as Mangano does, to make it clear for everyone:
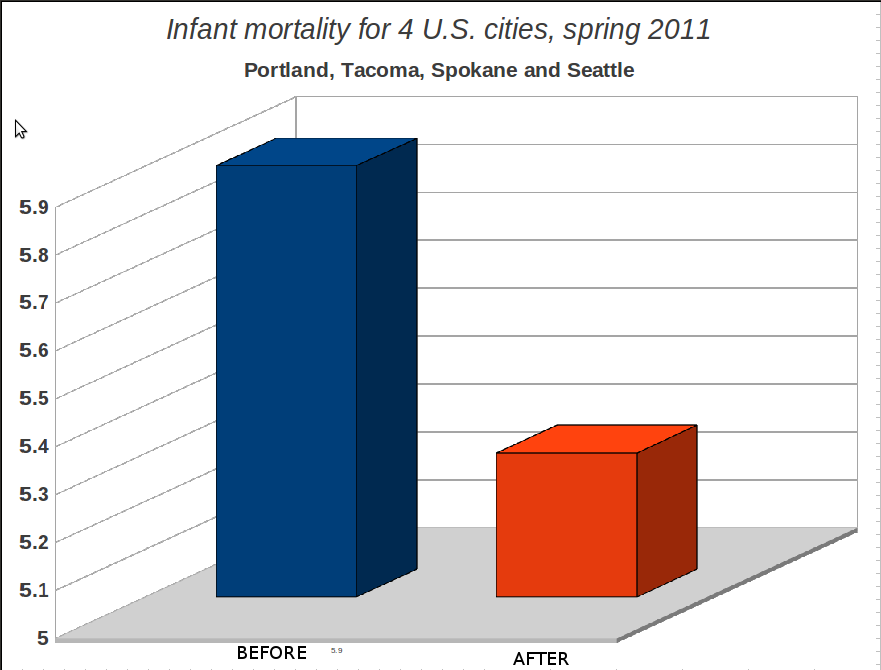
This is, of course, a very dishonest way of plotting things if you want to show the whole picture, but if Joseph Mangano can do it, they why shouldn’t we? The main point is anyhow clear, there is no increase in infant mortality in the United States of America due to Fukushima. Got it? And if there is, we will no find out through sloppy analysis by charlatans like Sherman and Mangano. And, as it seems, not through the statistics consultants that muck-raking journal CounterPunch is using. It will take careful analysis by serious researchers to find out if there is any real effect. If they would bother to start looking. But Mangano said in the Fox News interview
:
this is a red flag to raise for more studies to be done
Actually, he is right. It is a red flag to raise for careful scrutiny of all the earlier work by Sherman, Mangano, and their alarmistic friends. Some of their earlier studies have become “common knowledge” in anti-nuclear groups. Last year we had a member of the green party in Sweden standing in the parliament during a debate about nuclear power, where he referred to studies of increased childhood leukemia, authored by Sherman and Mangano, and of course the Chernobyl book edited by Sherman. Maybe we all can move on with life and more pressing issues now, ok? Those who want to hang on to all bad things with Fukushima still have plenty of material to work on. But stick to the facts, please. Ok? Two questions remain:
- Why is Alexander Cockburn’s editorial so forgiving towards Sherman and Mangano? If I had been the editor of a journal, I would be furious if it turns out that some authors make fools of themselves, and of me as an editor, by cheating with data, and I would make sure that they were never to publish anything more in my journal. Ever. Especially when it comes to such an important issue that worries millions of people, not the least parents of small children. But Cockburn is so happy to have, through Sprey’s re-analysis, found that there was indeed an increase, so Sherman and Mangano was right even if they cheated, no shadow should fall upon them. After all, CounterPunch is a muck-raking newsletter with a radical attitude, so there must be some muck to find, and indeed they found it. But when it now turns out that not even this was right, what will he write in the next editorial? “We follow proudly in the sensationalist footsteps of William Randolph Hearst!” or what? We have already established that Janette Sherman and Joseph Mangano should be very ashamed of themselves. If I was Alexander Cockburn I would at least be quite embarrassed.
- What went wrong in Sprey’s re-analysis?
An email has been sent to Alexander Cockburn, requesting that they do a muck-raking investigation of the skills of their statistical consultant. Furthermore, CounterPunch now has a great opportunity to recover their lost credibility; How about a couple of articles with in depth investigations of the earlier works of Janette Sherman and Joseph Mangano? This could be the starting point in a long series of muck-raking articles where all the controversial statements from the anti-nuclear icons are carefully scrutinized, could it be that there are more “common truths” out there that are based on the same weak evidence (i.e. none) as in the present case? Alexander Cockburn, are you up to the task?
Mattias Lantz – member of the independent network Nuclear Power Yes Please
P.S. What about Seattle? Some observant persons may have noticed from the table above that Seattle does have an increase in infant mortality by a factor 3 between week 11 (2 deaths) and week 12 (6 cases). At least Seattle has an effect due to Fukushima, pretty please? Well, I’ll give you the plot for Seattle:
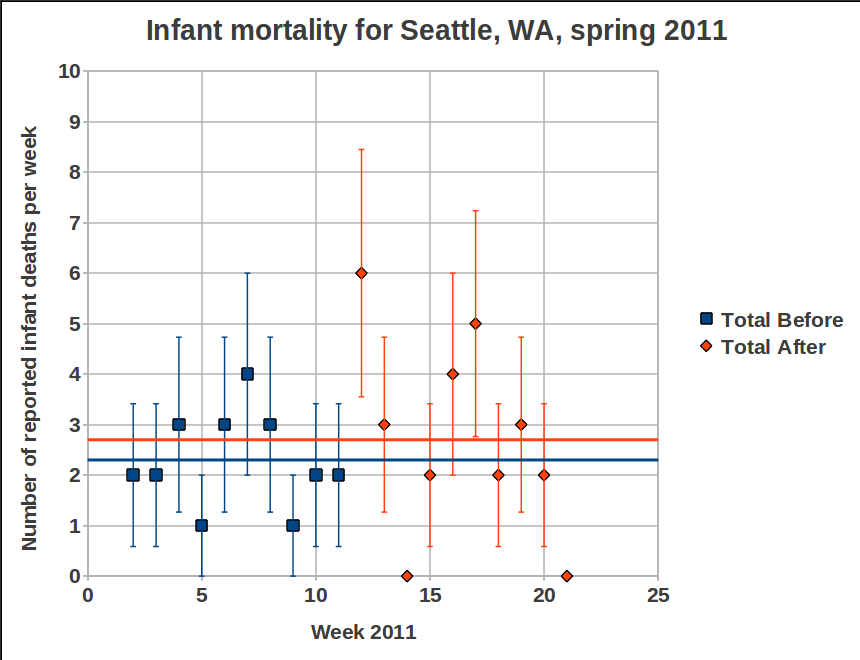
6 cases the week that the radioactivity reached Seattle, compared to 2 the week before, that must be significant! If you still insist on this kind of reasoning, it means that you somehow have ignored the plots I show here and here. Still not convinced? Then go to the CDC data base and pick out the numbers for yourself, and please do not forget to check the pattern for Seattle week by week for earlier years. Here are the links to the CDC data base, instructions for some of them are found if you place the pointer over the link. I recommend to start with the last one, it is the easiest to handle:
http://www.cdc.gov/mmwr/mmwr_wk/wk_cvol.html
http://www.cdc.gov/mmwr/preview/mmwrhtml/mm6010md.htm?s_cid=mm6010md_w#tab3
http://wonder.cdc.gov/mmwr/mmwrmort.asp
10 Comments
The previous post was written in a rush, and somewhat in anger. Here is an attempt to explain better.
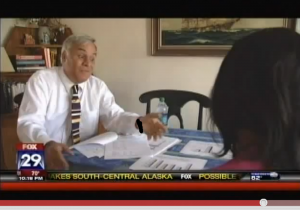
It seems as if it wasn’t enough for Joe Mangano to spread fear in the northwestern part of the U.S., so he decided to play the same game for Philadelphia, PA. One reason may be that relatively high levels of Iodine-131 in water have been recorded there recently. These are of course reasons for concern, and several reasons have been suggested (see for instance here(1), here(2) and here(3))
We leave that discussion aside and focus on Mangano’s new claims. For Philadelphia he suggests that a 48% increase of infant mortality is due to Fukushima. Below is the very detailed graphics (n.b.: irony) of the weekly rate of infant mortality before and after the radiation from Fukushima reached Philadelphia. The picture is a screen dump from the Fox News interview.
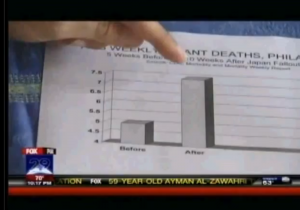
Please note that is not enough for Mangano to cherry-pick the data, he is also keen on making the increase look very high by cutting the scale at 4, thus the “After”-pillar looks three times larger than the “Before”-pillar. Oh well, let’s not stay sore over that, we go back to his claims.
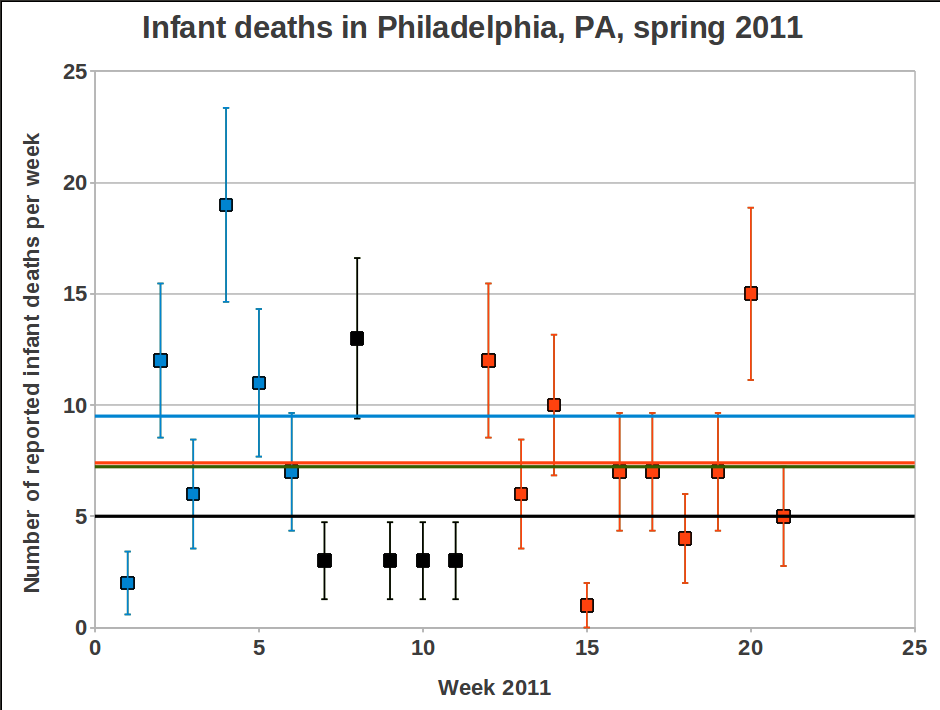
Mangano’s “Before”-pillar corresponds to weeks 7 to 11 (black boxes). For the northwest Sherman and Mangano used weeks 8-11, now it seemed important to bring down the average value by adding week 7 in order to reduce the effect of the high value for week 8. The average becomes 5.0, to be compared with the ten following weeks (week 12-21) which have an average of 7.4. This is 48% higher value, just as Mangano says.
But once again, if we look at the first 6 weeks of the year, we find that the average for that period is 9.5! And the average value for the first 21 weeks of 2011 is 7.42, i.e. slightly higher than the alarming 48% increase level that gave Mangano a few minutes on fame on TV. In other words, Joe is trying to take us for a ride again. shame on him.
During the interview with Fox News he says, among other things:
The real benefit is that this is a red flag to raise for more studies to be done.
and
Is this a fluke or is there some other reason?We’ll see, but we can’t rule out Japan. Its too…too distinct.
The talk about a red flag could be a valid argument if data were more convincning. But the data only becomes “…too distinct” if we allow Mangano to play his tricks with them, i.e. by not showing a longer time trend before Fukushima. But there is a red flag to raise, a warning flag that Joseph Mangano is not a man to trust in these matters. And if he has done this, what says that any of his earlier studies have been performed in a more honest way.
During the Fox News interview Mangano also claims that the data from CDC shows a decreasing trend for the corresponding weeks during the previous six years, and now after Fukushima we have a peak instead. Based on what we have seen above, this is a meaningless statement. My intention was to double check all the data for the last six years, but it takes some time to extract the data from the CDC data base and I have better things to do. Therefore I only show the data for 2010, with the same weeks marked for comparison.
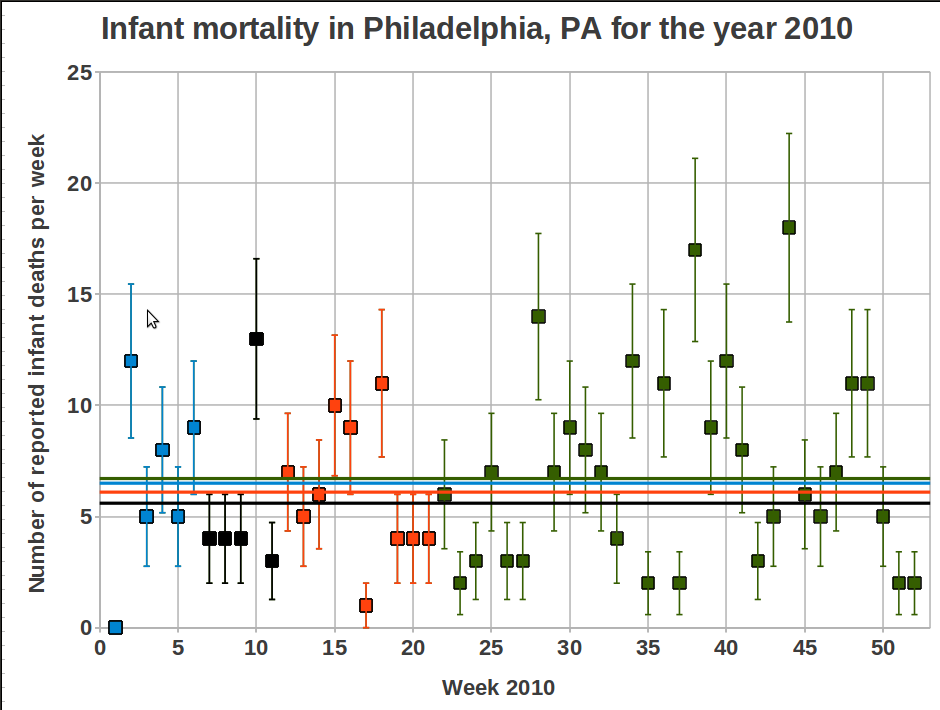
The mean values for the different time periods are:
- Weeks 1-6: 6.5 (9.5 for 2011)
- Weeks 7-11: 5.6 (5.0 for 2011)
- Weeks 12-21: 6.1 (7.4 for 2011)
- Weeks 1-21: 6.1 (7.43 for 2011)
- Weeks 1-52: 6.7 (answer for 2011 will come in January 2012)
So, just by comparing weeks 12-21 between 2010 and 2011 we see that yes, there is an increase for 2011, and Mangano may be correct about a decreasing trend for the years 2005-2010. But considering the great variation in data over the last year this does not indicate anything. There are many other things that Mangano would have to explain then as well, for instance why 7.4 infant deaths are of concern while 9.5 is not. Ah, silly me, a relatively high value is only important if there has been a nuclear accident during that time. Who am I to question that? 😉
Mattias Lantz – member on the independent network Nuclear Power Yes Please
Update 25 June 2011
Several persons have asked about how to get access to the raw data. I put a summary of the links I have used on the follow-up post regarding the strange results from the CounterPunch re-analysis of the data (here), but I will now put them here as well. The last link on the list is the one that is the easiest one to use. Some information will appear if you hold the pointer over each link:
http://www.cdc.gov/mmwr/mmwr_wk/wk_cvol.html
http://www.cdc.gov/mmwr/preview/mmwrhtml/mm6010md.htm?s_cid=mm6010md_w#tab3
http://wonder.cdc.gov/mmwr/mmwrmort.asp
12 Comments
It turns out that Joseph Mangano is trying to pull the same stunt by claiming a 47% increase of infant mortality in Philadelphia, PA, after Fukushima.
And here is a quick plotting of the data, I leave it to the readers to figure out the consequences of only using weeks 7 to 11 for comparison with the ten weeks after that.
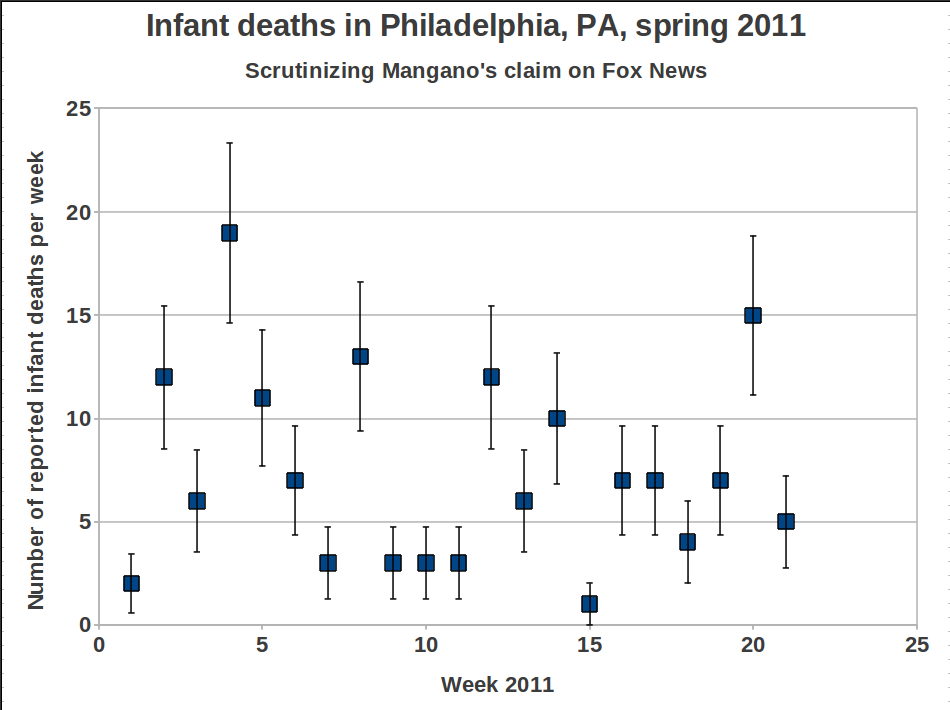
There is only one word for this: BULLSHIT!
/Mattias Lantz
Comments closedAnother week has passed and more steps have been taken to get the situation under control. Lets start with the usual reactor status table made out of NISA data:
| Reactor 1 | Reactor 2 | Reactor 3 | |
| Water level (meter)* | -1.7 | -2.1 | -2.15 |
| Flow rate(m3/min) | 8 | 7 | 9 |
| Core pressure (kPa) | 1390 | – | – |
| Containment pressure (kPa) | 120 | 60 | 102 |
| Wetwell pressure (kPa) | 110 | – | 183.2 |
| Feedwater nozzle temp (Celsius) | 119.8 | 115.6 | 202.1 |
| Bottom head temp (Celsius) | 96.9 | – | 151.9 |
| Wetwell temperature (Celsius) | 51.4 | 66.8 | 40.0 |
| Containment dose rate (Sv/hour) | – | 22.7 | 12.2 |
| Wetwell dose rate (Sv/hour) | 1.1 | 148 | 0.480 |
| *Distance from top of assembly | |||
| – broken gauges or missing data |
Everything looks pretty stable except the wetwell dose rater in the number 2 reactor. It has increased to well over 100 Sv/hour from 37.1 in the last update I made (i wrongly wrote 0.371). I haven’t been able to follow the news so closely the last week so I have not seen if this has been mentioned in any TEPCO press release. Below is a graph of the increase. If anyone know of any action done on the number 2 reactor, starting the 3 or 4th of may please write a comment to this blog post.

A air filtration system has been connected to the reactor building of reactor number 1. The purpose of it is to get airflow through the building and clean out the air activity by filtrating the air. It is hoped that it will be enough to allow workers to enter the building and work safely without getting to much dose.
Kyodo reports that TEPCO plans to send in workers on monday in order to measure dose rates within the building. Seems strange that they would send in people when they have already used robots once for that purpose.
A longer video clip of the number 4 spent fuel pool can be seen over at Atomic Power Review. It doesn’t appear to be very damaged.
The big news of the week is that the prime minister of Japan has asked Chubu electric to shut down its Hamaoka nuclear power plant. Hamaoka has 3 operational nuclear power plants, all of them quite new. Started at 1987, 1993 and 2004. The newest one is a ABWR and would presumably have state of the art eartquake protection. The reason for the prime ministers request is a estimate that the site has a high probability to be hit by a 8.0 earthquake within 30 years. If the reactors indeed can not handle such a quake then the closure request is rational. But it does smell a bit like political posturing at this point. There is no legal precedence for such a situation and it is not clear if Chubu electric has to obey the request.


Links(English)
WNN Filters for Fukushima Daiichi 1
Blogs(English)
Atomic Power Review Japan updates: Fukushima Daiichi, Hamaoka
NEI NEI Weekly Update on Fukushima Daiichi – 5/6/1
Blogs(Swedish)
Effekt Monbiot brottas med sig själv
Genusnytt En KARL ska väl tåla lite strålning…
Forskarbloggen Hur många döda efter Tjernobyl?
inas insikter Tjernobyl idag / Fukushima imorgon?
Begrundat och Plitat Cesium och Jod verkar ge spikes i Fukushima när man gläntar på dörren …
/Johan
2 CommentsAs the pace of events is winding down in Fukushima so are our updates.
JAIF and NISA updated data below in the table, click the links to see the time graphs from the FNPP1 blog:
| Reactor 1 | Reactor 2 | Reactor 3 | |
| Water level (meter)* | -1.7 | -2.1 | -2.25 |
| Flow rate(m3/min) | 6 | 7 | 6.5 |
| Core pressure (kPa) | 1175 | – | – |
| Containment pressure (kPa) | 105 | 75 | 103.3 |
| Wetwell pressure (kPa) | 105 | – | 179.6 |
| Feedwater nozzle temp (Celsius) | 114.7 | 119.2 | 80.6 |
| Bottom head temp (Celsius) | 95.0 | – | 112.9 |
| Containment dose rate (Sv/hour) | – | 24.8 | 17.0 |
| Wetwell dose rate (Sv/hour) | 1.5 | 0.371 | 0.527 |
| *Distance from top of assembly | |||
| – broken gauges or missing data |


Temperatures, pressures etc look quite stable. Pumping of water form the tunnel connected to the number 2 turbine building is marginally successful. Spraying of a resin to bind down radioactive material to the ground, and prevent it from stirring up into the air, is ongoing all over the plant area. TEPCO has managed to get a camera in to investigate the number 4 spent fuel pool and world nuclear news report that the damage is limited, below is a picture from WNN of the pool.

Atomic Power Review writes that NISA has doubts about TEPCO’s plans to flood the containments. The doubt is regarding the structural integrity of the containments with the added strain from such a huge amount of water. Flooding the containment is a part of TEPCO’s plan to restore recirculation cooling to the reactor so it will be crucial to see how TEPCO responds to NISA and if they can show the containments can handle it. If they can not show it conclusively, then they will have to devise a new plan on how to restore cooling. In my last post I was questioning why they would want to flood the containments in the first place, but then realized that if the reactor vessels are broken and leaking, then the only way to submerge the fuel completely is to raise the level of water in the containment to the same level as the top of the fuel assemblies within the reactor vessel. I don’t see why this would be needed for the number one reactor, since it seems like it is holding pressure very well and must be pretty intact. But might be the only way for the number 2 and 3 reactors.
Over at The neutron economy one can read a blog post on the expected first yearly dose relased by the US department of energy, below is a map of it.
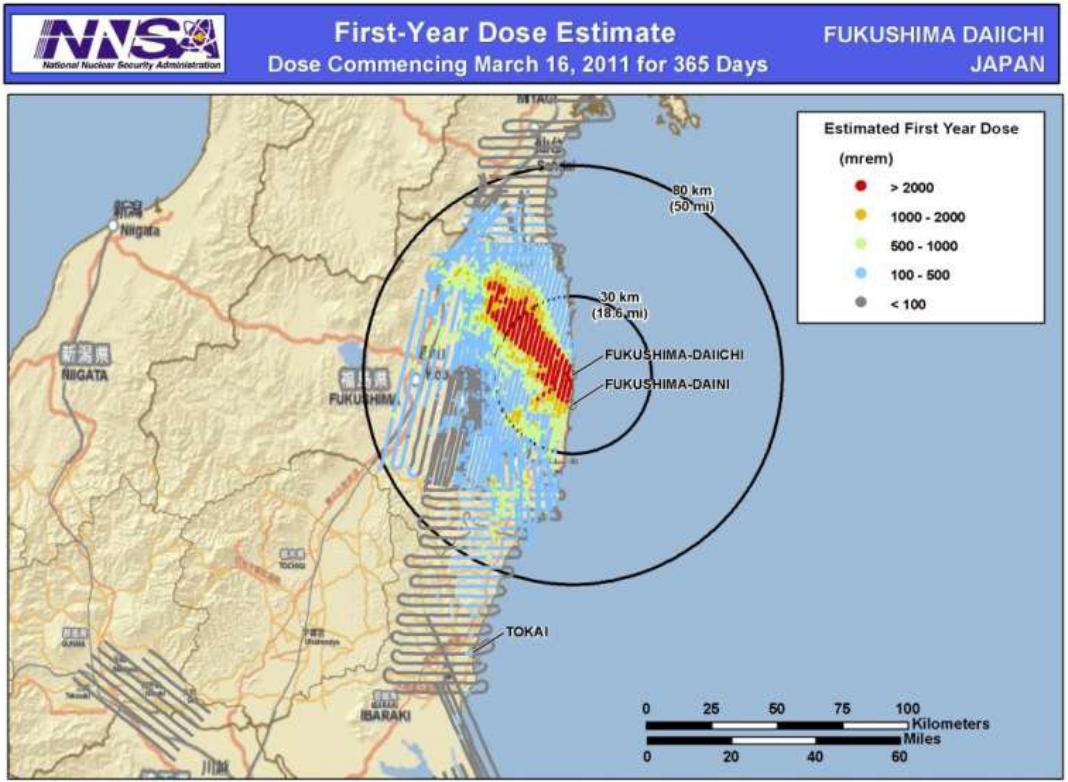
The dose rate is based on the following assumptions:
- Assumes no reduction for spending time indoors
- Takes into account decay of the radionuclides
- Takes into account gamma ray from ground deposits and inhalation of stirred up particles from the ground
The map is using the common american unit millirem. One millirem is equal to 0.01 millisievert. The red area marks the area where one would get more than 20 mSv/year if one lives there given the above assumptions. Yellow area is 10-20 mSv, green area is 5-10 mSv and blue area 1-5 mSv. Neutron Economy also shows a picture with more detail of the over 20 mSv area that can be found in this link. Close to the plant it will be up to 200 mSv and in some hot areas 100 mSv. Some of the hot areas are outside of the initial 20 km evacuation zone and that explain the new evacuation areas. It is not immiedietly dangerous to be in those areas but one probably does not want to live there. It will be interesting to hear what plans will be made to clear out the areas. Outside of Fukushima dose rates are down to natural backgrounds levels according to IAEA. Seems like bans on shipping of most kind of food products have been lifted.

More information about exposed workers have been released, so far it looks like this:
- 200 – 250 mSv 2 workers
- 150 – 200 mSv 8 workers
- 100 – 150 mSv 11 workers
In summary one can say that the situation as far as radiation levels are concerned is improving. Radiation levels are decreasing everywhere. The situation with the reactors are fairly stable, but long term cooling is still a big question mark.
/Johan


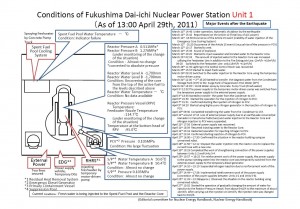

Links(English)
World Nuclear News No significant damage to fuel at unit 4
Blogs(English)
NEI Nuclear NotesWeekly Updated
Atomic Power Review NISA instruction to TEPCO
The Neutron Economy Expected Doses Over a Year and Evacuation of Fukushima Towns
Blogs(Swedish)
Dagens Kotka Tre härdsmältor på samma plats
Fourfact webloggen Naturligt kärnkraftsmoratorium
Stockholmscollage Vad har uranpolitikerna att frukta
Svensson En annan värld – kampen mot kärnkraft
Akkomp’s blogg Som ett smycke
11 Comments
Tepco has released more information about their plan to stabilize the Fukushima reactors(link 1, link 2). Their table of measures to be taken is hard to read, but the schematic of the plan is quite enlightening and i have attached it below.
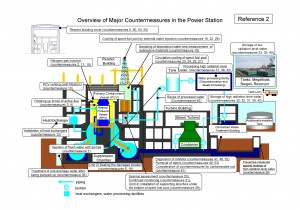
They are basically facing 4 problems, ensuring long term cooling of the cores, ensure cooling of the spent fuel pools, prevent release of radioactive material and mitigate the consequences of the releases that will continue for a while. I want to speak a bit more about cooling in this blog post since it is the most crucial problem.
As I have written before (and I will repeat it again, bear with me), the most important thing is to get circulation cooling going again. The current way of cooling the reactor, by pumping in water, letting it boil and then venting the steam out into the containment, is not a long term solution since one is continuously adding water to the system. The volume of the containments are large, but not infinite. One can’t put more and more water in there without it sooner or later coming out out somewhere, somehow. We are seeing that in the large leakage from the number 2 reactor. Cooling by circulation simply means one pushes water into the core somewhere and take it out somewhere else. The water taken out is then run through a heat exchanger that cools the water by dumping the heat into a heat sink (the ocean). There are a bunch of different cooling systems in a reactor.
During normal operation of a BWR(boiling water reactor), heat is carried by steam from the core, the steam passes through a turbine that generates electricity and then the seam goes through a condenser that cools it into a liquid state again, before its pumped back into the core. The condenser in turn is connected to water flow from the sea, a river or some other big body of water that keeps the condenser cool so it is able to condense the steam.

When the reactor is shut down there is still decay heat that needs to be removed. One does not want to produce steam during shutdown so the normal cooling by letting steam go through the main steam line out to the condenser is not an option. All BWR’s has recirculation pumps that takes some of the core water and recirculates it within the vessel, during normal operation this is done to control the steam level in the core. Connected to this recirculation loop is pumps and pipes that can lead water to a heat exchanger that dumps heat to some heat sink before it is circulated back. This system is used to provide cooling during shutdown and is called the Residual Heat Removal (RHR) system. It’s capable of getting rid of the decay heat (heat that continues to be produced from decay of fission products, long after the fission chain reaction is shut down) and keeping the water in the reactor at below 100 degrees Celsius.

The above two options both require electricity do drive pumps, both for the internal circulation but also to get seawater to the heat exchangers that cool the water in the internal circuit. If for some reason pumping power is lost there is a system that kicks in and can run for a short time period (hours). The system is called the Reactor Core Isolation Cooling (RCIC) system. It works by using a temporary heat sink. All BWR has something called a “wetwell”, the wetwell is a water filled volume within the primary containment below the reactor pressure vessel (that contains the core). In an emergency one can shut the main steam outlet and the main feedwater inlet to isolate the containment from the sounding environment. The steam generated in the core is instead diverted into a small turbine that drives a pump that pumps water into the core from the wetwell or from a water storage tank. After passing through the turbine the steam is dumped down into the water in the wetwell. When mixing with the water the steam will condensed and can be pumped back into the core, at the cost of heating up the wetwell water. When the wetwell water gets close to boiling point it can no longer absorb any heat and it stops acting as a heat sink. When that happens no more water gets returned to the reactor and water level starts to drop in the core. Usually it can absorb a couple of hours worth of decay heat. This system was the system that was cooling all the Fukushima reactors for the first hours after the accident. It is almost a passive system, it doesn’t require any large amounts of electricity but it do require some small power from batteries for control.

The trouble in Fukushima started after the RCIC shut down. There was no power to start up the RHR and water level started to drop causing the fuel in the core to be damaged and release radioactive material into the water in the core. As a emergency move TEPCO then started to inject water into the core to cover the fuel again, without having anywhere to dump the steam getting produced. They have been doing that during all the time so far. The hope was that they would be able to restart the RHR system after recovering power to the reactor. But the tsunami drenched all the switchboards for the control room and also flooded the turbine hall basement where apparently a lot of the equipment related to the RHR is located. Leaks from the core afterwards contaminated this water so much that workers can not get to the equipment to restore the RHR.
The dilemma for TEPCO is that they can’t repair the equipment for the RHR as long as the cores are leaking radioactive water, but the cores will continue to leak as long as TEPCO continues to inject water into the cores without having restored the RHR circulation. So what can they do in a situation like this? They have desperately been trying to find some way to pump out enough water to be able to start repairs, but to no good. Even if they could it is doubtful the repairs can be made quickly, likely the entire system is completely trashed after having been drenched with salt water for weeks. That leaves TEPCO with only one option, create a new RHR loop.
What they are planning to do as far as I can tell is to install a bunch of heat exchangers somewhere with access to seawater. Then they will pump water out of the reactors, through the heat exchangers and then back in. Just like the RHR would do. The difference is that they are going to have to pump the water in pipes straight out of the containment and reactor building. One would normally never do such a thing since the risk of a leakage is not trivial and due to the radioactivity of the water, once they start pumping, no one will be able to be close to the pumps or pipes. It would not be very pleasant for instance if a new earthquake where to rip the pipes apart while they are pumping, but the option of not doing anything isn’t really an option at all and if they can get that cooling working then they could more briskly get to work on restoring the real RHR system.
What confuses me at this point is where they will connect the new temporary system. First they where talking about connecting it to the feedwater line and some kind of fire extinguishing system, both connecting to the reactor vessel. That would be ideal since it would prevent crap from getting out of the core and into the containment, which is the main problem, since the containment on the number 2 reactor is leaking and causing the big problem in the turbine hall basement. But now, from the plan I posted above, they indicate will instead flood the containment and connect one end of the temporary RHR to it while the other end goes into the core. They will in other words circulate water:
From core -> into containment -> out of the containment through a heat exchanger -> then back into the core.
I don’t see how this solves anything since it is the amount of water present in the containment that seems to be causing the leakage problem in the first place! But I guess their plane will become more clear in the future.
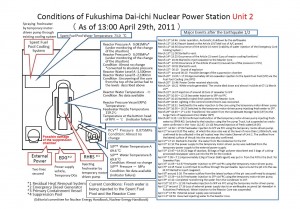
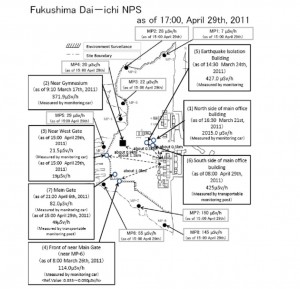
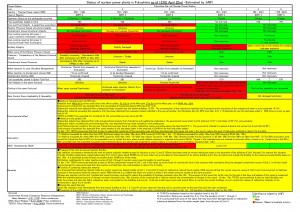
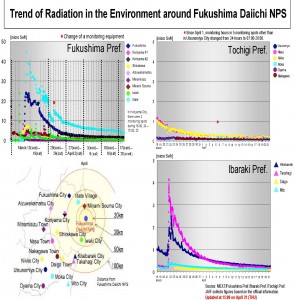
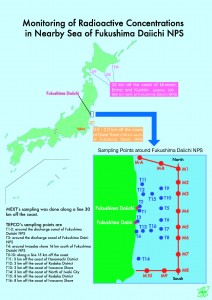
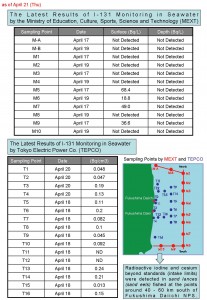
As for other news. There is nothing new about the status of the reactors as can be seen from the pictures below, temperatures in all three reactors continue to go down. Pressure in number one reactor seems to have stabilized a bit and the declining trend in radiation levels around Fukushima continues.

Links(English)
World Nuclear News Roadmap for Fukushima Daiichi restoration
World Nuclear News Plans for Fukushima basement pumping
Kyodo News Japan bans residents from remaining within 20-km of Fukushima plant
Blogs(English)
Brave New Climate Energy debates in Wonderland
Depleted Cranium Assessing the Long Term Danger to Fukushima Workers
NEI Nuclear Notes TEPCO’s Plans to Stabilize Fukushima-Daiichi
NEI Nuclear Notes Analysis of Replacing Japan’s Nuclear Plants With Other Technologies
Atomic Power Review AREVA awarded water treatment plant contract…
Damian Carrington Unsure about nuclear power? Here’s the five questions you must answer to decide
NEI Nuclear Notes ANS Nuclear Cafe – “Why is there irrational fear of radiation?”
NEI Nuclear Notes Italy, Poland (and Its Neighbor Germany), Exxon
All Things Nuclear Cleanup Lessons from TMI for Fukushima?
Links(Swedish)
Uppsala Tidning ”Ompröva kärnkraftsbeslutet”
Blogs(Swedish)
Jinge Vad har vi lärt oss?
Svensson Fukushima lika allvarligt som Tjernobyl
Supermiljöbloggen Kina gör svängom efter Fukushima
Förbannad Pacifist Marianne Stieger: En strålande framtid
Kunskapssamhället Säkerhetszon runt Fukushima
/Johan
13 CommentsIt seems like TEPCO has realized it will take some time for them to restore the internal circulation pumps in reactor 1-3. The equipment has been drenched in salt water for some time now and the highly radioactive water in the turbine halls makes it very hard to do any kind of work. The normal cooling works by having water circulating through the core, then going through a heat exchanger that transfers heat from the water to an outer circulation loop that transports the heat to some kind of heat sink (in this case the ocean). The form of cooling that TEPCO has been doing since this accident started is to simply pump water into the cores, where it boils and creates steam that they then blow down into the wetwell. This means water is going into the building, but not leaving it. As anyone can realize that can’t go on forever until water comes out somewhere because the wetwell and containment doesn’t have infinite volume to store water. All the crap water that has been leaking into the sea is a result of this cooling method.
Since they have to try to prevent more leakage into the sea and they can’t get the internal cooling working TEPCO was left with the choice to build a new closed loop with new heat exchangers. All one really need is a pipe where one can put water into the reactor and another pipe where one can take the water out. Connect that to a heat exchanged and voila you have new circulation cooling without any need to fill the wetwell with steam. That is exactly what TEPCO is going to do.
That isn’t a solution without problems though. The reactor circulating through the core will become very radioactive due to the partially melted fuel, so any pumps and pipes used will be dangerous to approach. Everything has to be set up in such a way that once started it will run quite reliably, because repairing things won’t be easy. It would also be quite dirty if the pipes or pumps starts leaking so they better make them tight. Still it seems like a better and more long term solution than what they doing right now and it seems to be necessary in order to get rid of the radioactive water in the turbine halls, in order to get access to the real pumps and restore/replace them. Right now water is leaking out as quickly as they can pump it away.
The above strategy is a part of a bigger plan to stabilize all the reactors, stop all leakage of radioactive material and put all 3 reactors into cold shutdown. TEPCO estimates it will take 6-9 months before its all finished. Among other things TEPCO will build up storage and processing facilities for the radioactive water, build covers over the damaged reactor buildings , somehow repair the breach in the number 2 wetwell (one article mentioned “sticky concrete”) and inject nitrogen into all the containments. Atomic Power Review has a nice short list.
It is positive that TEPCO seems to have a long term plan, lets hope they will be able to proceed with all the steps without to many unexpected problems.
TEPCO has driven around inside the reactor buildings with a robot equipped with radiation detectors and the dose rates within the buildings are around 50 mSv/hour. A worker could only work there for 5 hours before they exceed the maximum allowed dose limit. I wonder how they plan to deal with that and I also wonder how they have measured it.
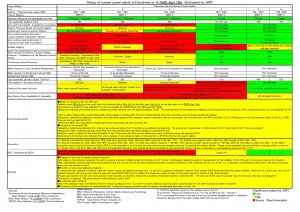
The status of the reactors are fairly unchanged. Temperature going down in the number one reactor.
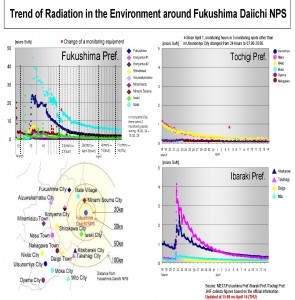
Dose rates are going down, the gamma dose rates are according to IAEA
Gamma dose rates are measured daily in all 47 prefectures. The values tend to decrease over time. For Fukushima, on 18th April a dose rate of 1.9 µSv/h was reported. In the Ibaraki prefecture, a gamma dose rate of 0.13 µSv/h was reported; in all other prefectures, reported gamma dose rates were below 0.1 µSv/h.
Dose rates are also reported specifically for the Eastern part of the Fukushima prefecture, for distances beyond 30 km from Fukushima-Daiichi. On 16th April, the values in this area ranged from 0.1 to 25 µSv/h.
Only in a few prefectures, I-131 or Cs-137 is detectable in drinking water at very low levels. As of 16th April, one restriction for infants related to I-131 (100 Bq/l) is in place in a small scale water supply in a village of the Fukushima prefecture.
The areas with a ground contamination of more than 1 MBq/m^2 of Cs-137 sounds quite limited, seems like there are some hot spots west of Fukushima. From IAEA:
Only in a few prefectures, I-131 or Cs-137 is detectable in drinking water at very low levels. As of 16th April, one restriction for infants related to I-131 (100 Bq/l) is in place in a small scale water supply in a village of the Fukushima prefecture.
On 15th and 16th April, the IAEA Team made measurements at 44 different locations in the Fukushima area at distances ranging from 20 to 58 km, West from the Fukushima nuclear power plant. At these locations, the dose rates ranged from 0.6 to 37 µSv/h. At the same locations, results of beta-gamma contamination measurements ranged from 0.03 to 2.8 Megabecquerel/m2. The highest values were observed at distances of less than 30 km from the power plant.
On 17th April, the IAEA Team made measurements at 17 different locations in the Fukushima area at distances ranging from 20 to 62 km, North and Northwest from the Fukushima nuclear power plant. At these locations, the dose rates ranged from 0.4 to 3.3 µSv/h. At the same locations, results of beta-gamma contamination measurements ranged from 0.03 to 0.27 Megabecquerel/m2.
I hope someone will soon release maps of ground contamination so one can get a sense for how much land will be unusable.
Links(English)
World Nuclear News Robots investigate Fukushima reactors
World Nuclear News Roadmap for Fukushima Daiichi restoration
Reuters Opposition to huge India nuclear plant hardens
Reuters Special Report: The nuclear industry’s trillion dollar question
Reuters Japan nuclear operator aims for cold shutdown in 6-9 months
Reuters Inside Fukushima
Blogs(English)
Atomic Power Review Tepco plans further details
NEI Nuclear Notes UCS Science: How Many Cancers Did Airlines Really Cause
Idaho Samizdat Fukushima’s future blueprints are incomplete, danger persists
Idaho Samizdat Impact of Fukushima on new U.S. reactor projects?
Depleted CraniumTerrified of Nuclear Energy, Germany Goes for Fossil Fuel
Links(Swedish)
DN debatt ”S uppdrag är att skrota kärnkraften”
Blogs(Swedish)
Mats Engström Granska Strålsäkerhetsmyndigheten
Begrundat och plitat Twitter om Fukushima och Tepcos plan (som just presenterades) radioaktiviteten ner om 3 månader
Flute Hänt i veckan 10-17 april, del 1
Sven Tycker Avveckla kärnkraften
Dr Angel Sanningen om Fukushima – vi klarar bara små doser åt gången
Motvallsbloggen Fukushima? Vadå, vi har ju inga jordbävningar här?
22:00(CET)/20:00(UTC)/05:00
Not much newsworthy to report today. JAIF report as usual on the status of the reactors. No new NISA update on the reactor status in English but in Japanese, some values are taken from IAEA rather than NISA. Links to graphs are links to the blog #FNPP1 and Irradiation. Pressure is continuing to rise in the number one reactor but still quite low. Seems like there is some kind of leakage out of the containment in number one, otherwise one would have expected higher pressure due to the nitrogen injection. Pumping of water from the number 2 turbin building basement is ongoing but slow, TEPCO say the work can take weeks.
| Reactor 1 | Reactor 2 | Reactor 3 | |
| Water level (meter)* | -1.65 | -1.5 | -2.2 |
| Flow rate(liters/min) | 100 | 116.67 | 116.67 |
| Core pressure (kPa) | 1034 | 100*** | 100*** |
| Containment pressure (kPa) | 190 | 100*** | 100*** |
| Wetwell pressure (kPa) | 165 | – | 168 |
| Feedwater nozzle temp (Celsius) | 204.5 | 166.9 | 92.2 ** |
| Bottom head temp (Celsius) | 119.0 | 208.0 | 116.0 |
| Containment dose rate (Sv/hour) | – | 27.9 | 16.9 |
| Wetwell dose rate (Sv/hour) | 10.3 | 0.653 | 0.653 |
| *Distance from top of assembly | |||
| – broken gauges or missing data | |||
| ** Probably faulty reading | |||
| *** IAEA states atmospheric pressure |


Yesterday NISA released this info about how much activity has escaped from the Fukushima reactors and compare it to Chernobyl.
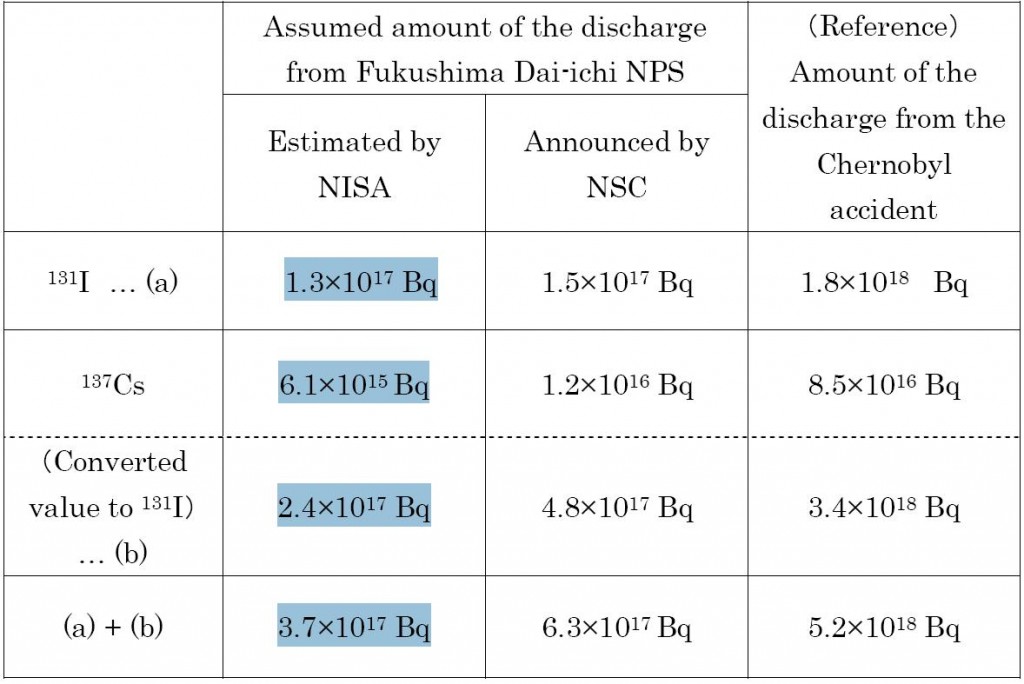
Like I said yesterday its roughly 10%. The move from 5 to 7 on the INES scale has gotten a lot of media attention, but what does it really mean? Nothing became worse yesterday than it has been, no dramatic event changed the rating etc. What happened is that NISA estimated that the release of I-131 and Cs-137 is beyond a treshold of what is considered “Major release of radioactive material” acording to the level 7 definition:
Level 7.
- Major release of radio active material with widespread health and environmental effects requiring implementation of planned and extended countermeasures
That is all, NISA hasn’t made any statement about health impacts. They certainly don’t claim the effects will be as severe as the effects where from Chernobyl. One can at this point exclude the possibility that Fukushima will be as severe. So what are the differences?
- In Chernobyl 134 workers got exposed to high enough radiation(over 1 Sievert) to develop symptoms of acute radiation sickness, 28 of them died during the first year following the accident, two others died from injuries not related to radiation. A lot of kids got exposed to I-131 due to no quick warnings not to drink milk and no supply of iodine pills. 4000 kids got thyroid cancer and 15 died due to it. 600 000 liquidators where exposed to doses around 100 mSv.
In Fukushima so far 22 workers have been exposed to over 100 mSv, the highest getting 198 mSv, thus there where 30 000 times as many people exposed to 100 mSv or more in Chernobyl compared to Fukushima so far! The only two deaths at the power plant was direct deaths due to the tsunami. No one has died due to the nuclear accident itself, not from any of the explosions, not from radiation etc. Dose estimates for the people outside of the evacuation zone, especially the people within 30km, has not been given so far.
- In Chernobyl the radionuclide release was directly into the atmosphere and it was going on for several days driven by the graphite fire. Other radionuclides than I-131 and Cs-137 could easily escape and was spread (even though Cs-131 is the biggest issue). The areas around Chernobyl where not quickly evacuated. The core blew apart due to a runaway chain reaction(a inherent weakness to that design that was well know, but the Russians ignored it and built them anyway),
In Fukushima it is still not entirely clear what caused the majority of release, it was either the venting of the containments or due to the breach in the number 2 wetwell. Regardless of the cause the atmospheric emissions was much smaller in magnitude, took place during a shorter time period, after the civilian population had already been evacuated! We are seeing pretty much only Iodine and Cesium(trace levels of other radionuclides have been detected, but no large release of them has been reported). The cores are largely intact, two of the containment vessels are likely breached but by far from cracked open like eggs. The cause of the emissions are partial meltdowns of the cores, a much slower process than the runaway explosion in Chernobyl. After the first few days of venting where over the majority of leakage goes into the sea, although that is not a “good” thing it is unlikely it will have any measurable impact on health. Anything going into the sea will get diluted fairly quickly. Even if the total release will increase to the same size as the ones from Chernobyl the different release path means it will have much less impact on public health or the environment.
Those two points alone mean that Fukushima is not another Chernobyl. The public health effects will not be as large and the environmental impact will be smaller. It remains to be seen how large surface areas have gotten high Cs-137 fallout, that will be the determining factor in how large areas will be unfit for farming or living on.


Links(English)
Reuters Japan struggles with nuke plan
World Nuclear News Fukushima workers start emptying trench water
Blogs(English)
Atomic Insights Rational Answer to Carl Pope’s Dismissal of Nuclear Technologies
Depleted Cranium Shameful Reporting From the New York Times
NEI Nuclear Notes Wednesday Update
Atomic Power Review Boiling Water Reactors Part 1 and Part 2
Atomic Power Review Fukushima Daiichi developments… Tuesday evening
Atomic Power Review A couple of afternoon updates….
Links(Swedish)
Aftonbladet Tyvärr har jag fått rätt
SvD Fukushima inte lika allvarligt som Tjernobyl
Blogs(Swedish)
Den blinde Argus Kortsiktighet, instabilitet och populism
Begrundat och plitat Fukushima, risken för nya olyckor, och sanningens ögonblick
Tänkvärt? Eller inte Fukushima likvärdig med Tjernobyl.
SNF’s blog Fukishima kan vara värre än Tjernobyl
Nolow Kärnkraftverk
Hovbergs blog Nukleära utrymningsområden<
Röda Berget Skräcken för strålning skapar nya offer
Harald i Uppsala Reflektioner 13 april